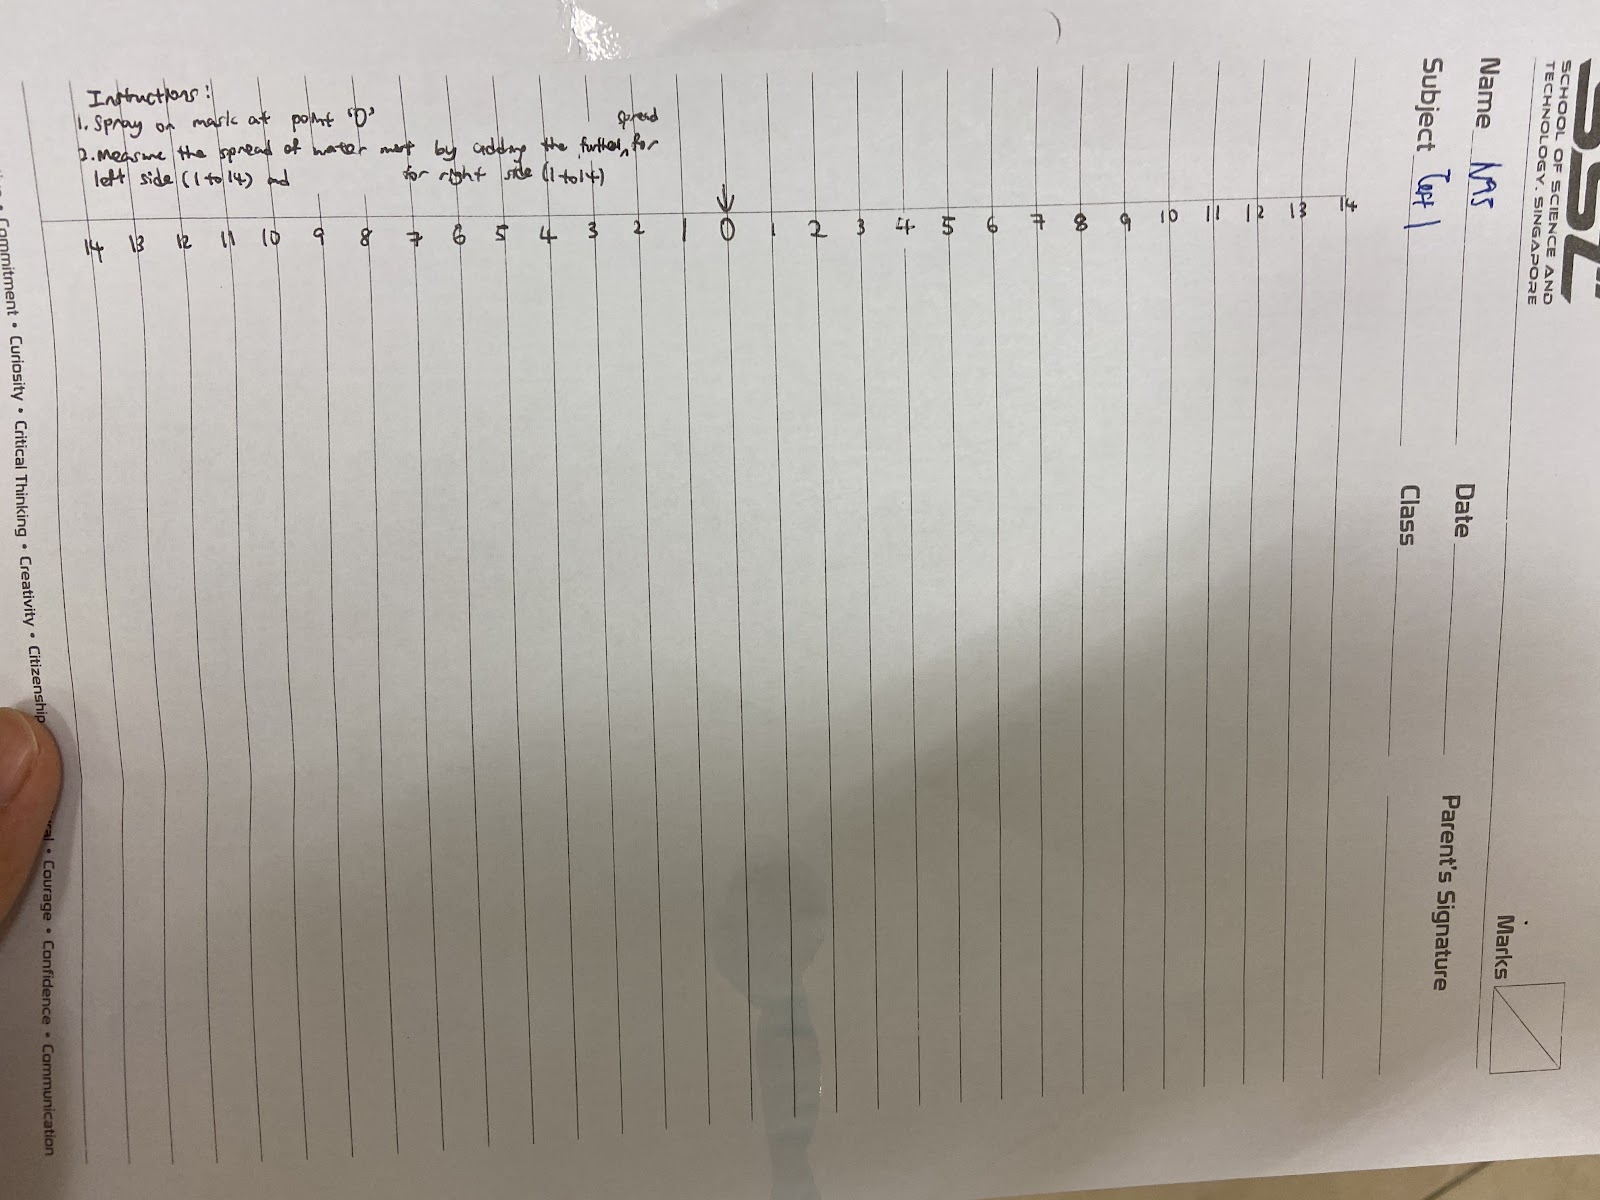
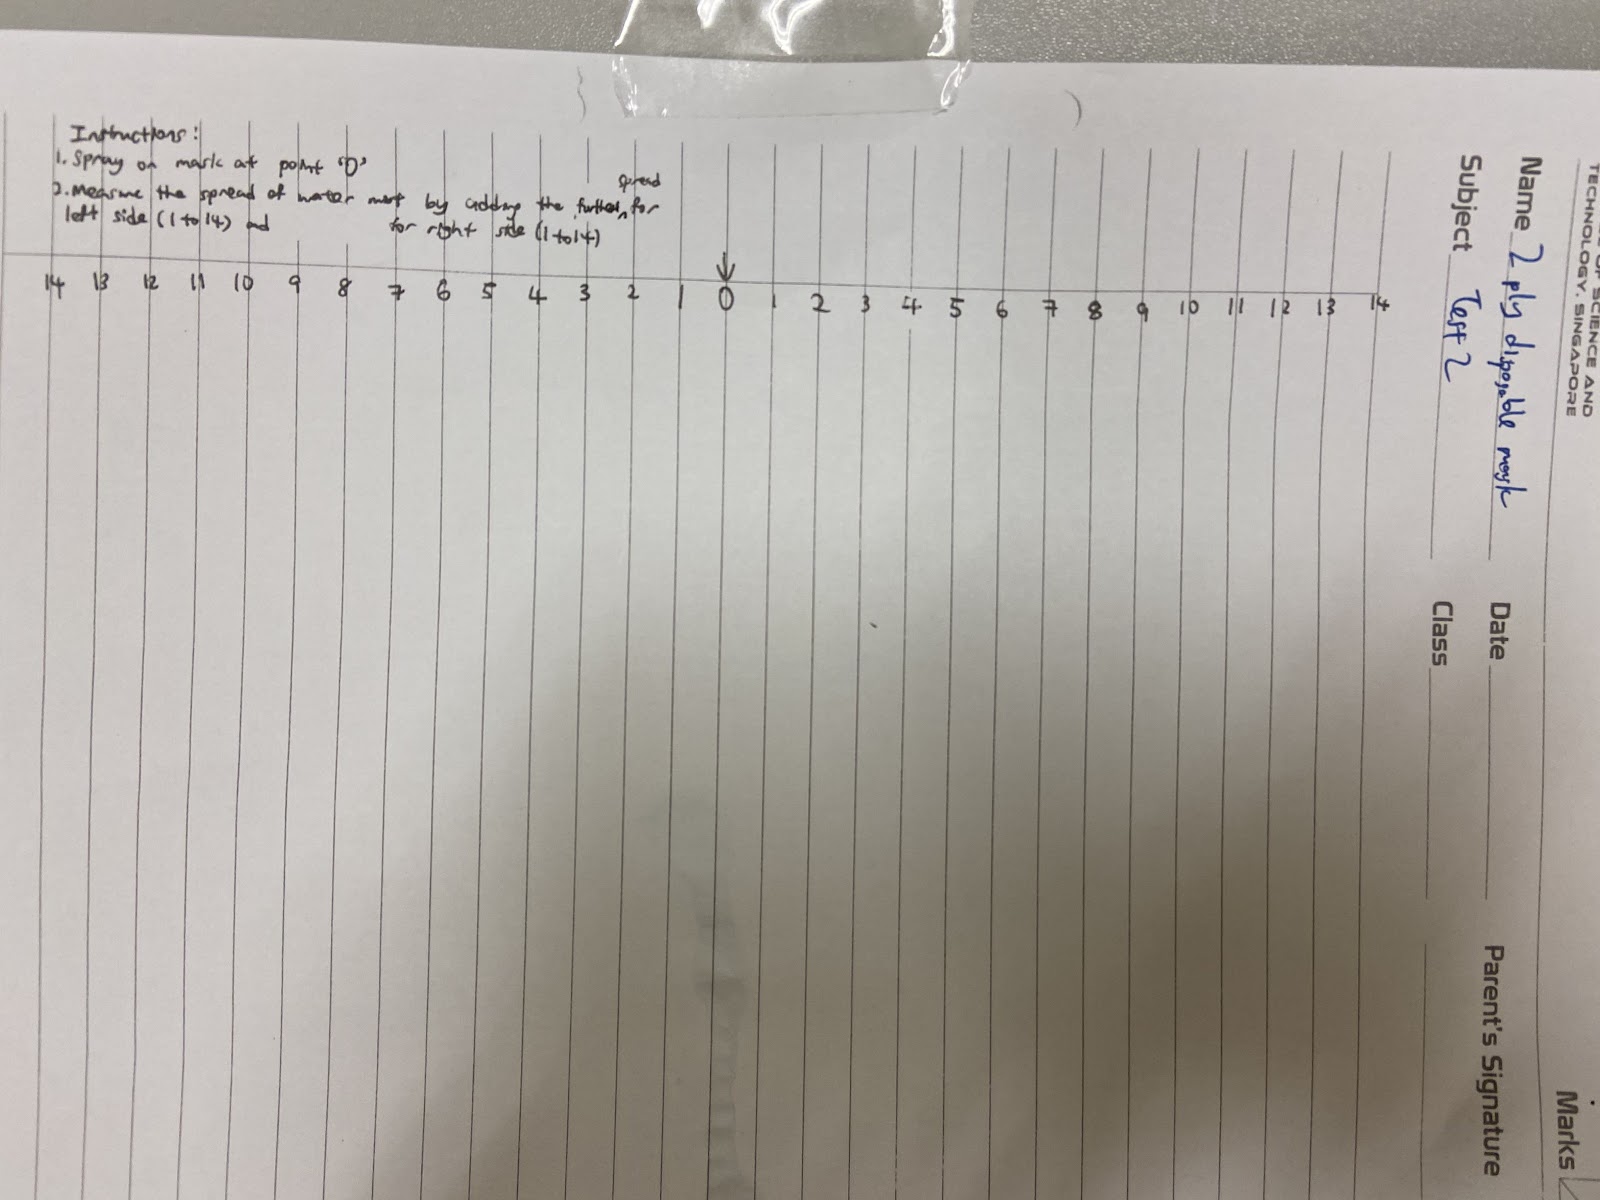
The results of our experiment are as shown below:
Type of mask | Spread of water mist (Note: 1 point = 0.7cm). Refer to 1.1 Background Research for more information on how the test works. |
| Image | Test 1 | Test 2 | Test 3 | Test 4 (due to big difference between results) | Average
|
Control
| 
| 26 points = 26 * 0.7cm = 18.2cm |
N95 
| 
| 2 points = 2 * 0.7cm = 1.4cm | 1 point = 1* 0.7cm = 0.7cm | 0 points = 0 * 0.7cm = 0.0cm | - | 0.7cm |
2 ply disposable mask 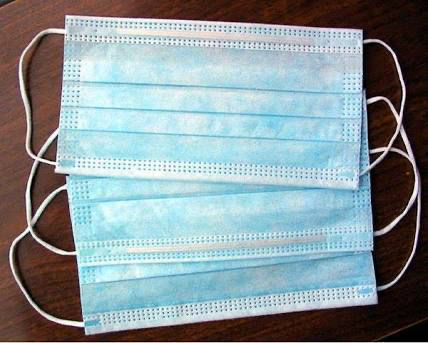
| 
| 14 points = 14 * 0.7cm = 9.8cm | 11 points = 11 * 0.7cm = 7.7cm | 10 points = 10 * 0.7cm = 7.0cm | - | 8.2cm |
3 ply disposable mask 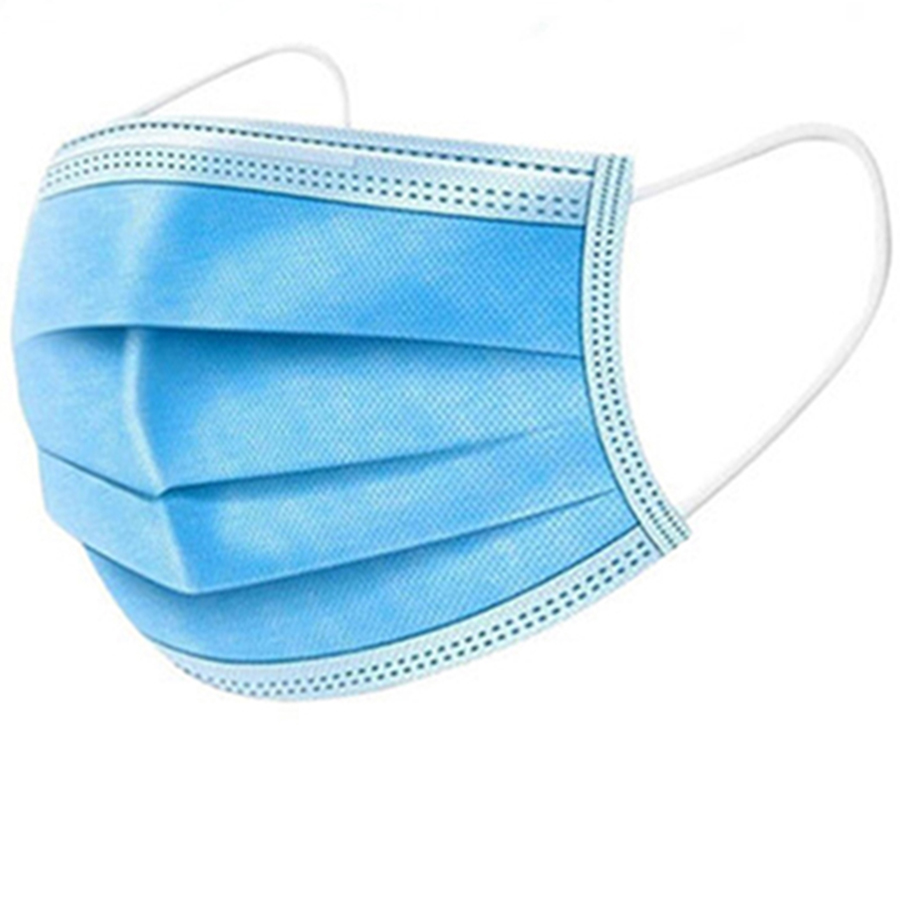
| 
| 2 points = 2 * 0.7cm = 1.4cm | 2 points = 2 * 0.7cm = 1.4cm | 2 points = 2 * 0.7cm = 1.4cm | - | 1.4cm |
Reusable cloth mask without filter 
| 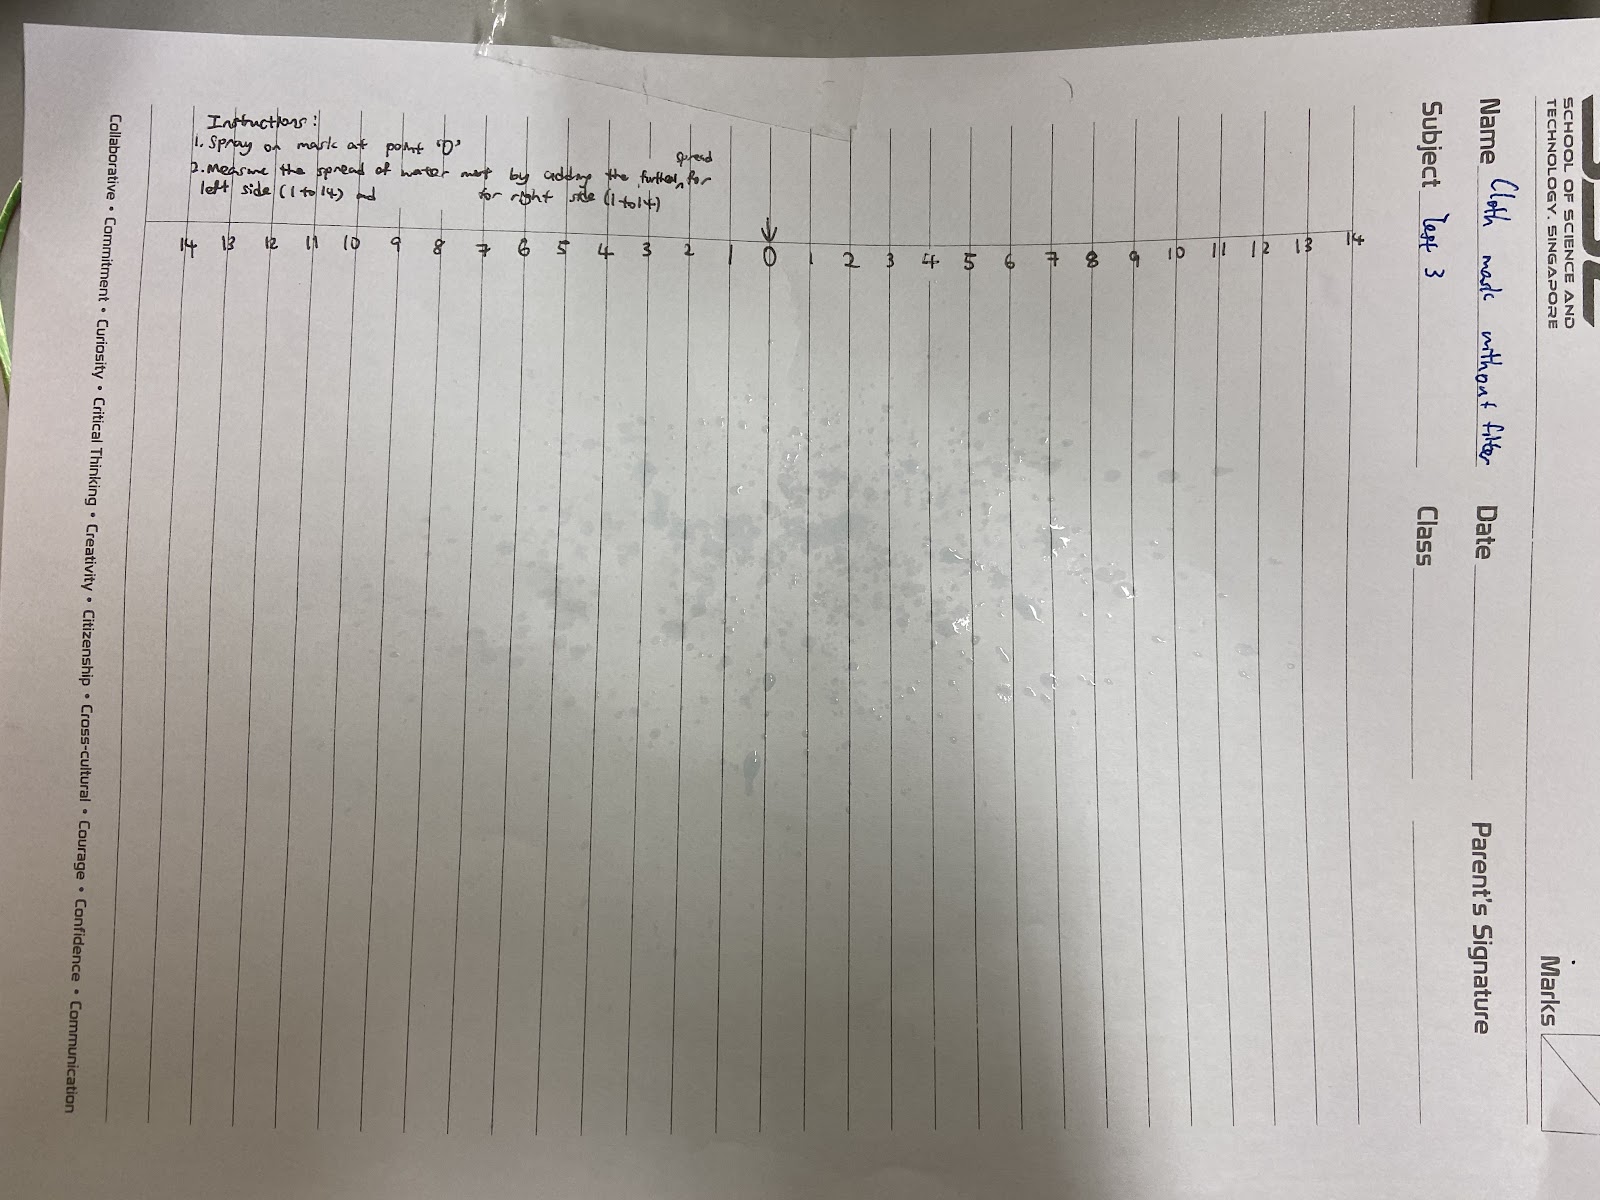
| 0 points = 0 * 0.7cm + 0.0 cm | 15 points = 15 * 0.7cm = 10.5cm | 22 points = 22 * 0.7cm = 15.4cm | 21 points = 21 * 0.7cm = 14.7cm | 13.5cm |
Reusable cloth mask with filter 
| 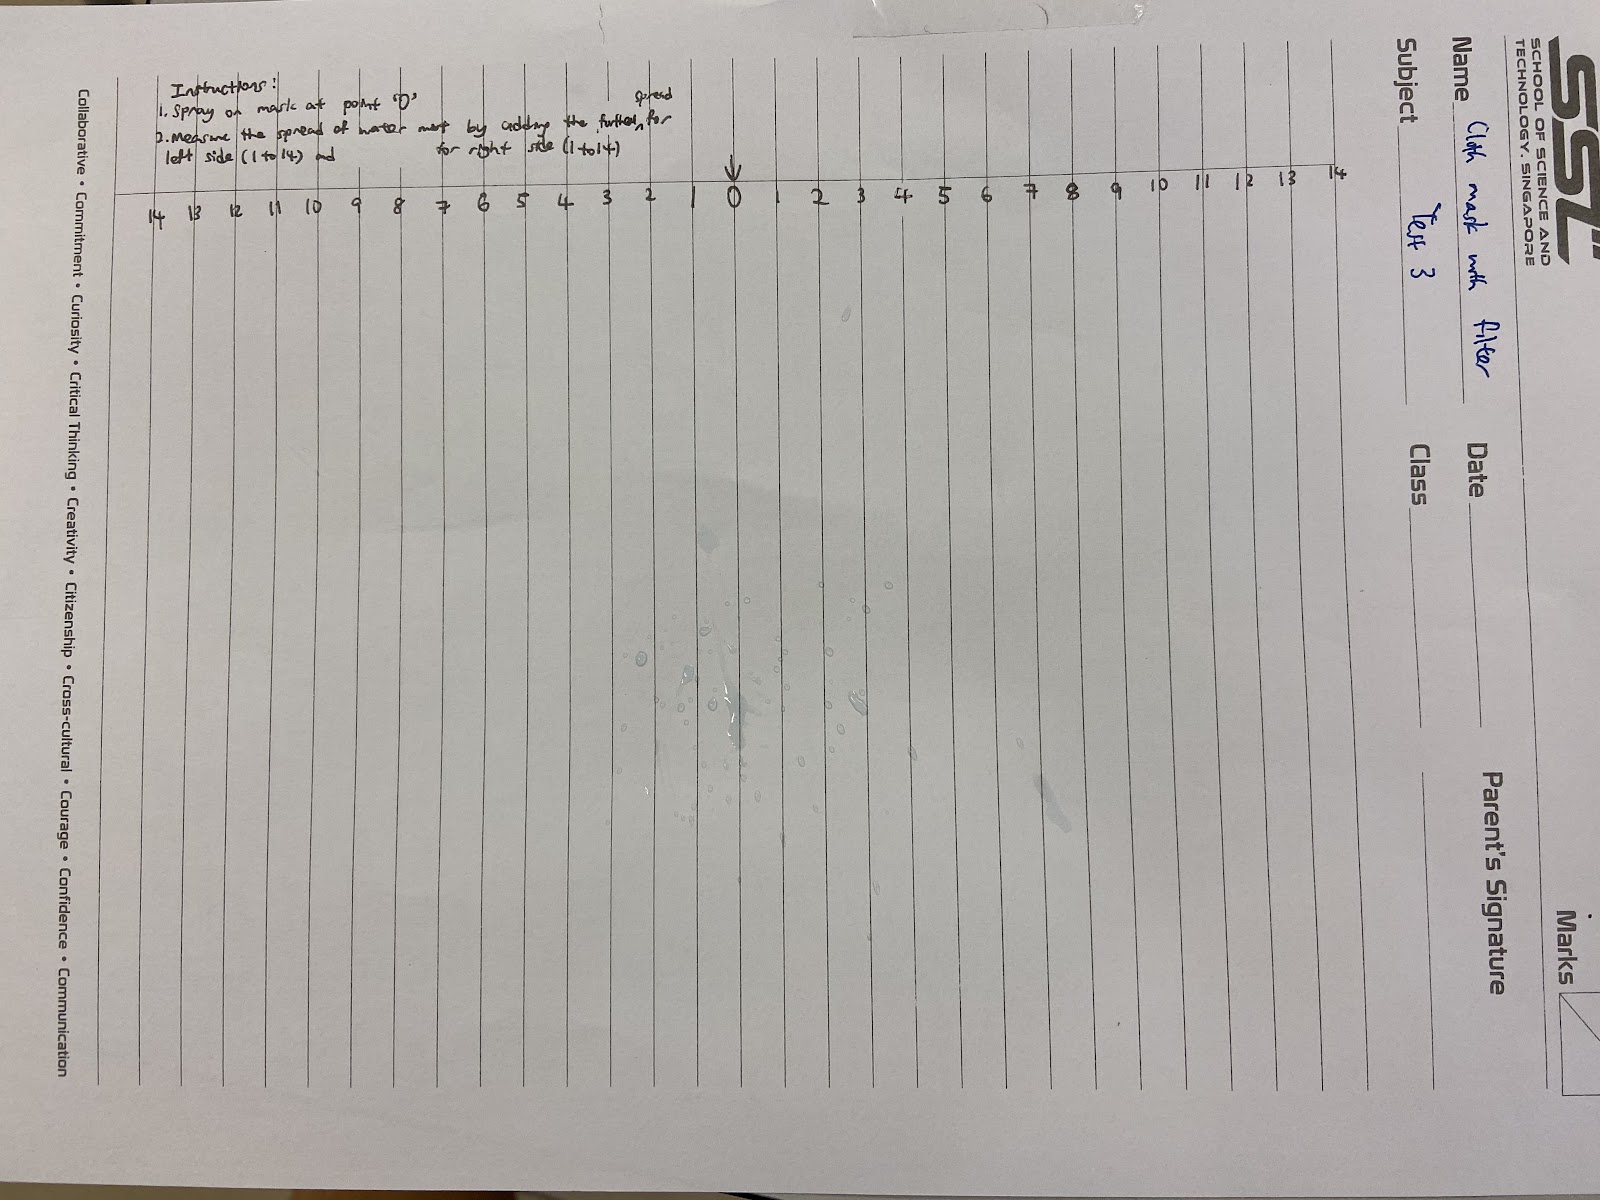
| 0 points = 0 * 0.7cm + 0.0 cm | 6 points = 6 * 0.7cm = 4.2cm | 12 points = 12 * 0.7cm = 8.4cm | 0 points = 0 * 0.7cm = 0.0 cm | 3.2cm |
Bandana 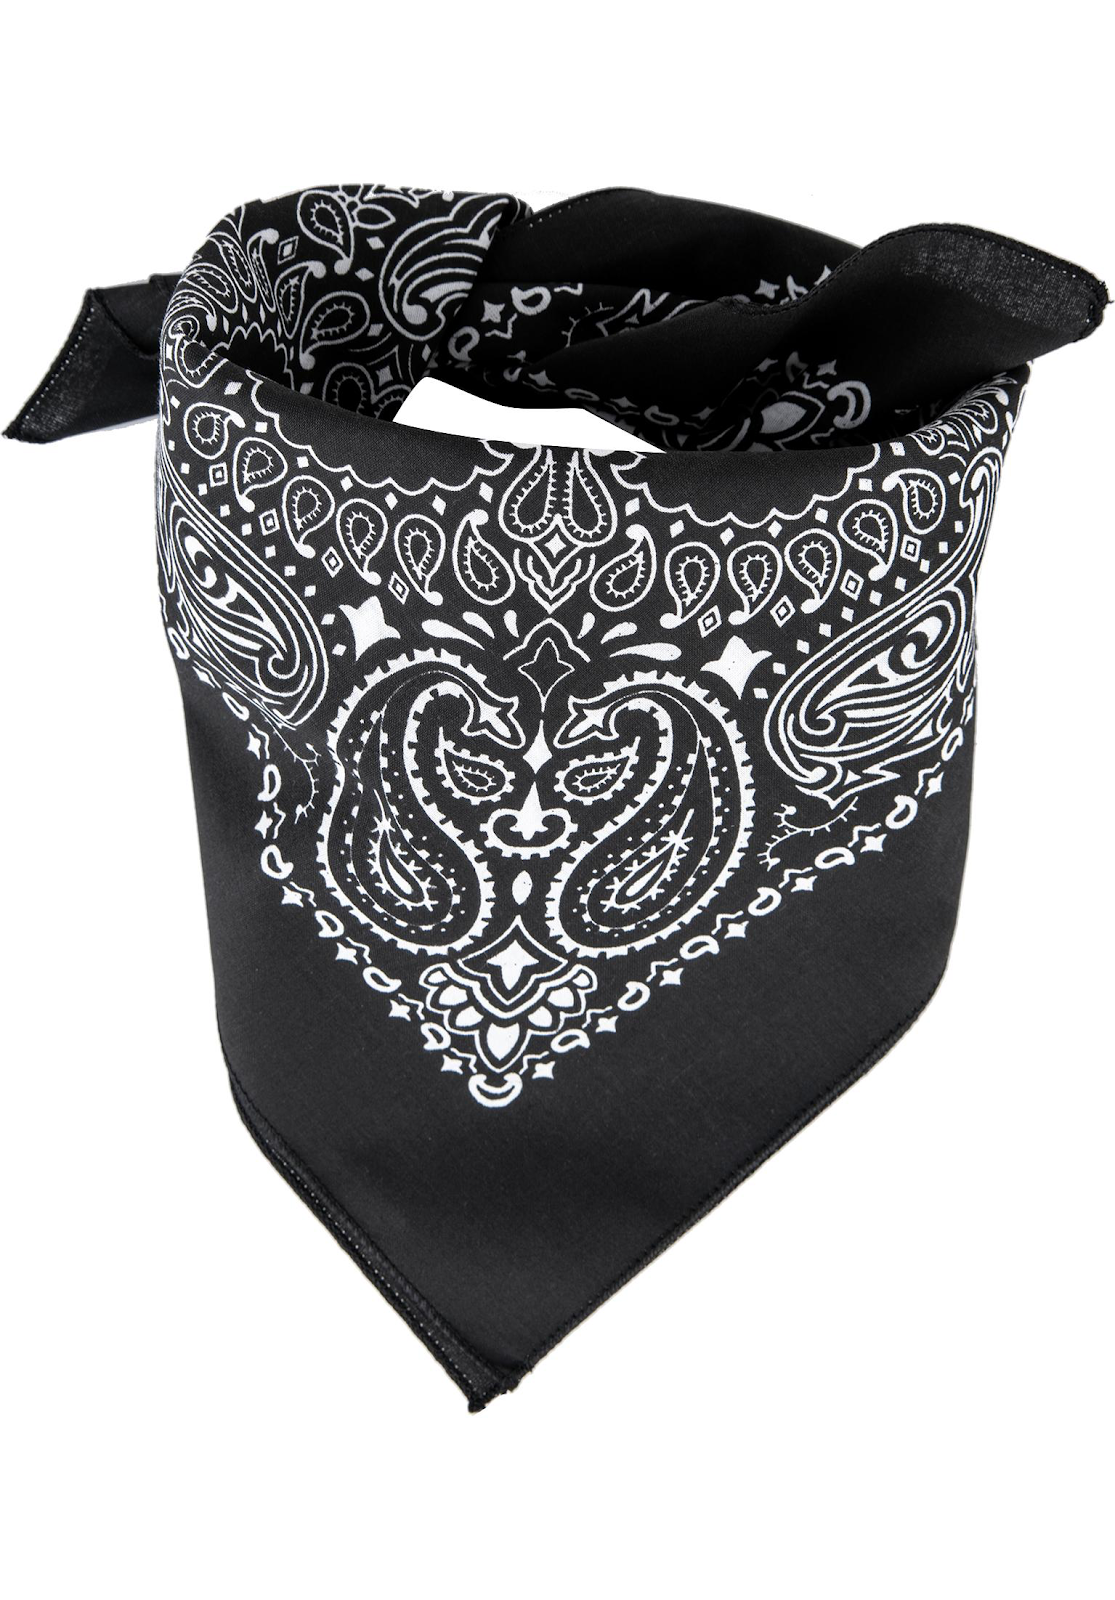
| 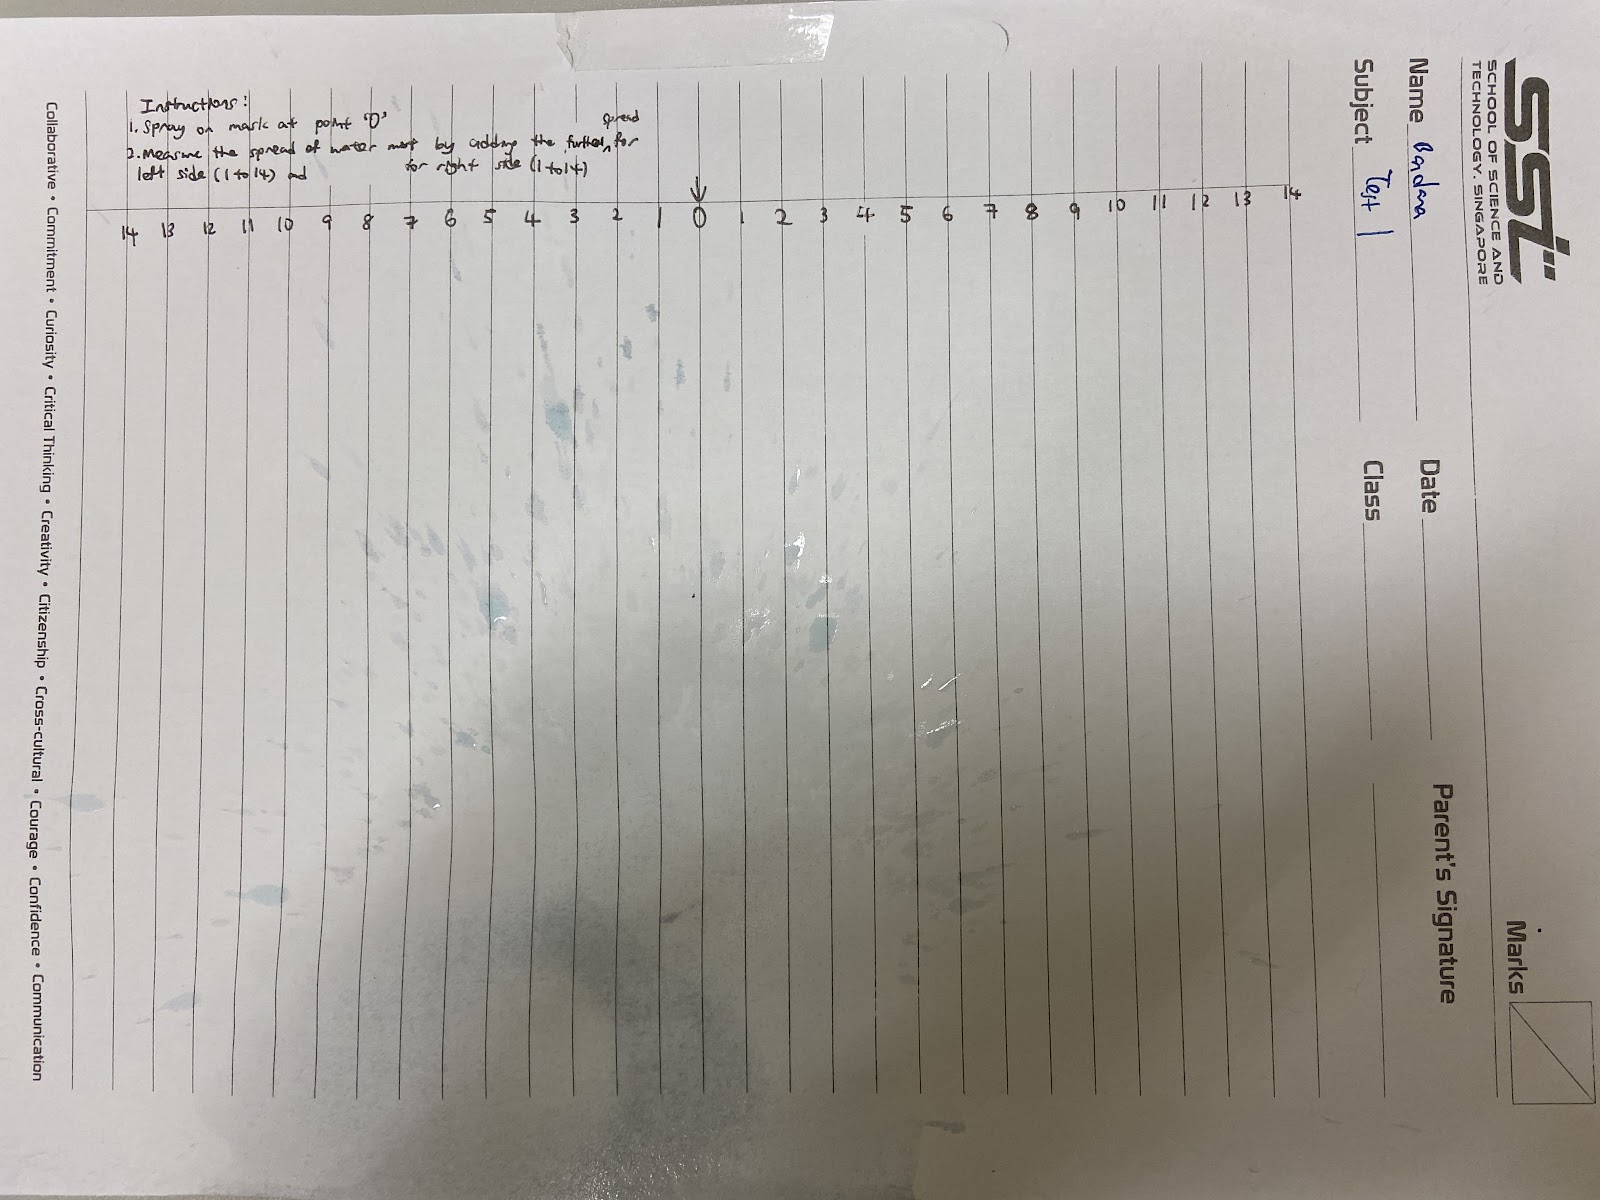
| 23 points = 23 * 0.7cm = 16.1cm | 28 points = 28* 0.7cm =19.6cm | 22 points= 22* 0.7cm = 15.4cm | - | 17.0cm |
Figure 3.0.1: Table with our results

Figure 3.0.2: Bar graph showing the spread of water mist through mask against the types of masks

Comments
Post a Comment